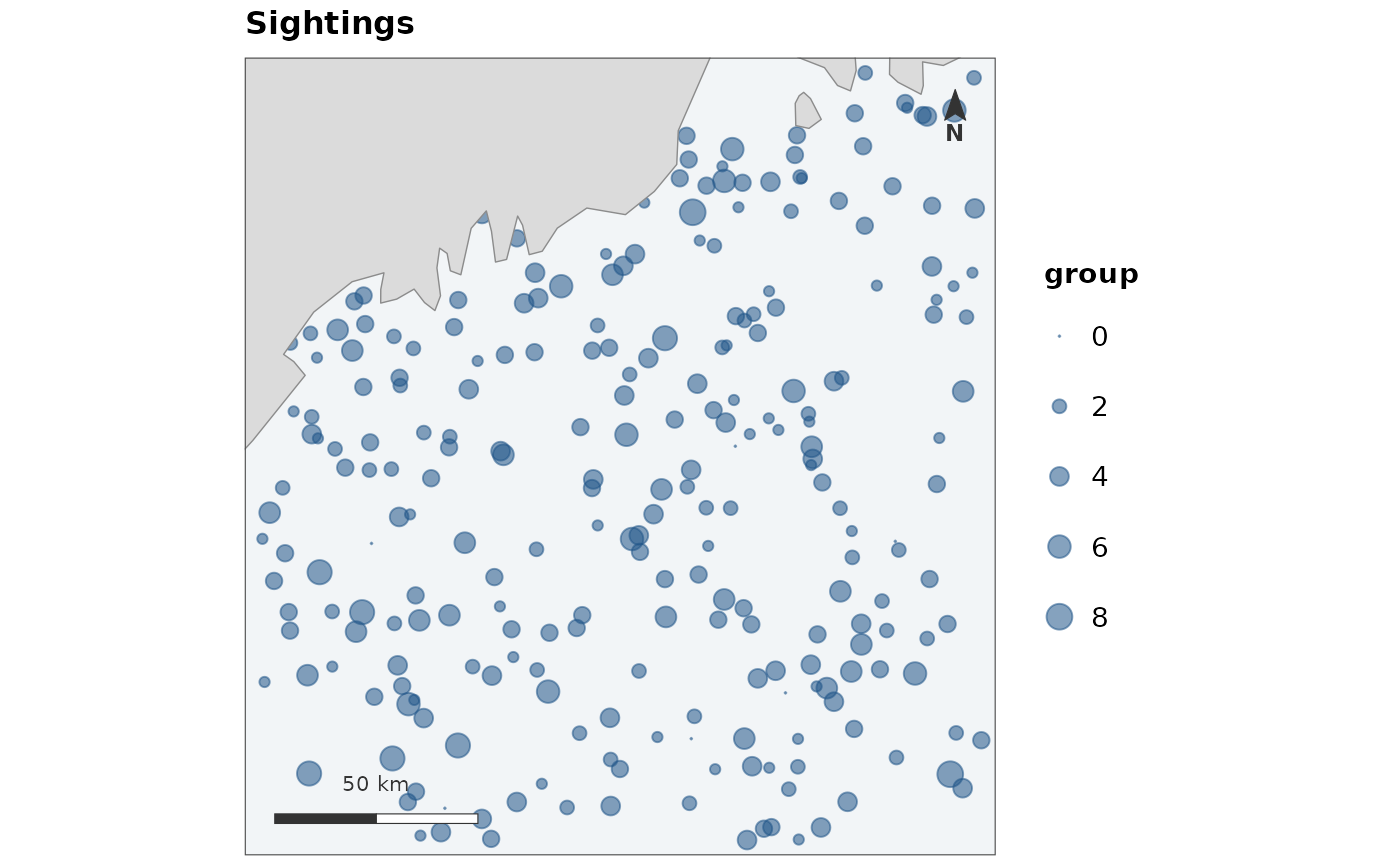
Tracklines, segment midpoints and sightings: where the survey went and what it saw. The map that says what the model was fitted from, and the one a reader checks a prediction against.
Usage
map_effort(
  tracks = NULL,
  points = NULL,
  value = NULL,
  size = NULL,
  bin = NA,
  bins = 40,
  fun = NULL,
  coords = NULL,
  crs = NULL,
  label = NULL,
  coastline = TRUE,
  region = NULL,
  title = NULL,
  subtitle = NULL,
  caption = NULL,
  scalebar = TRUE,
  north = TRUE,
  scalebar_position = "bl",
  north_position = "tr",
  graticule = FALSE,
  base_size = 12,
  theme = NULL,
  bin_threshold = 2000,
  expand = 0.02
)
Arguments
- tracks
An
sfobject of lines – the tracklines – orNULL.- points
An
sfobject of points: segment midpoints, or sightings.- value
A column of
pointsto colour by, such as group size.NULLdraws them in one colour.- size
A column of
pointsto size by. Group size is the usual one, and sizing by it rather than colouring by it leaves colour free for something else.- bin
Whether to aggregate the points into hexagonal bins instead of drawing them.
NA(the default) decides from how many there are;TRUEandFALSEforce it. See below.- bins
How many bins across the extent, when binning.
- fun
How to summarise
valuewithin a bin."count"when novalueis given, which is what an effort map wants.- coords, crs
Passed to
as_map_data().crsis also the CRS the map is drawn in – seedisplay_crs().- label
What to call the value in the legend. Defaults to the column name.
- coastline
Where land comes from.
TRUEchooses a source for the extent,FALSEdraws none, a path or ansfobject supplies one. Seecoastline().- region
An
sfpolygon to outline over the map – the study area, or whatever the grid was cropped to.- title, subtitle, caption
Figure text. The caption is where provenance belongs: which period, which product, which correction was not applied. Anything this function had to decide – a capped scale, a missing coastline – is appended to it.
- scalebar, north
Whether to draw the furniture. See
scale_bar()andnorth_arrow().- scalebar_position, north_position
Which corner each sits in:
"bl","br","tl"or"tr". Two pieces of furniture asked into the same corner are warned about rather than moved – which corner is free depends on where the data sits, and only the caller can see that.- graticule
Whether to label coordinates. Off by default; see
theme_fancymap().- base_size
Base font size in points.
- theme
A theme to use instead of
theme_fancymap().- bin_threshold
How many points before binning becomes the default. 2,000, which is roughly where overlap starts hiding structure at ordinary figure sizes.
- expand
How much margin to leave around the data, as a fraction of its own extent. Widen it when the data does not reach anything a reader can orient by – a small grid in open water shows no coastline at all until the panel is wide enough to include one.
Binning
Eight thousand segment midpoints on one map is a black smear, and it is a
smear that looks like data. Past bin_threshold points the default is to
bin them with fancyfx::hex_bin() and say so, rather than to draw a figure
whose density is set by the plotting order.
The threshold is 2,000, which is roughly where overlap starts to hide
structure at ordinary figure sizes. Force it either way when you know
better: bin = FALSE on a sparse map, bin = TRUE on a dense one that
happens to fall under the line.