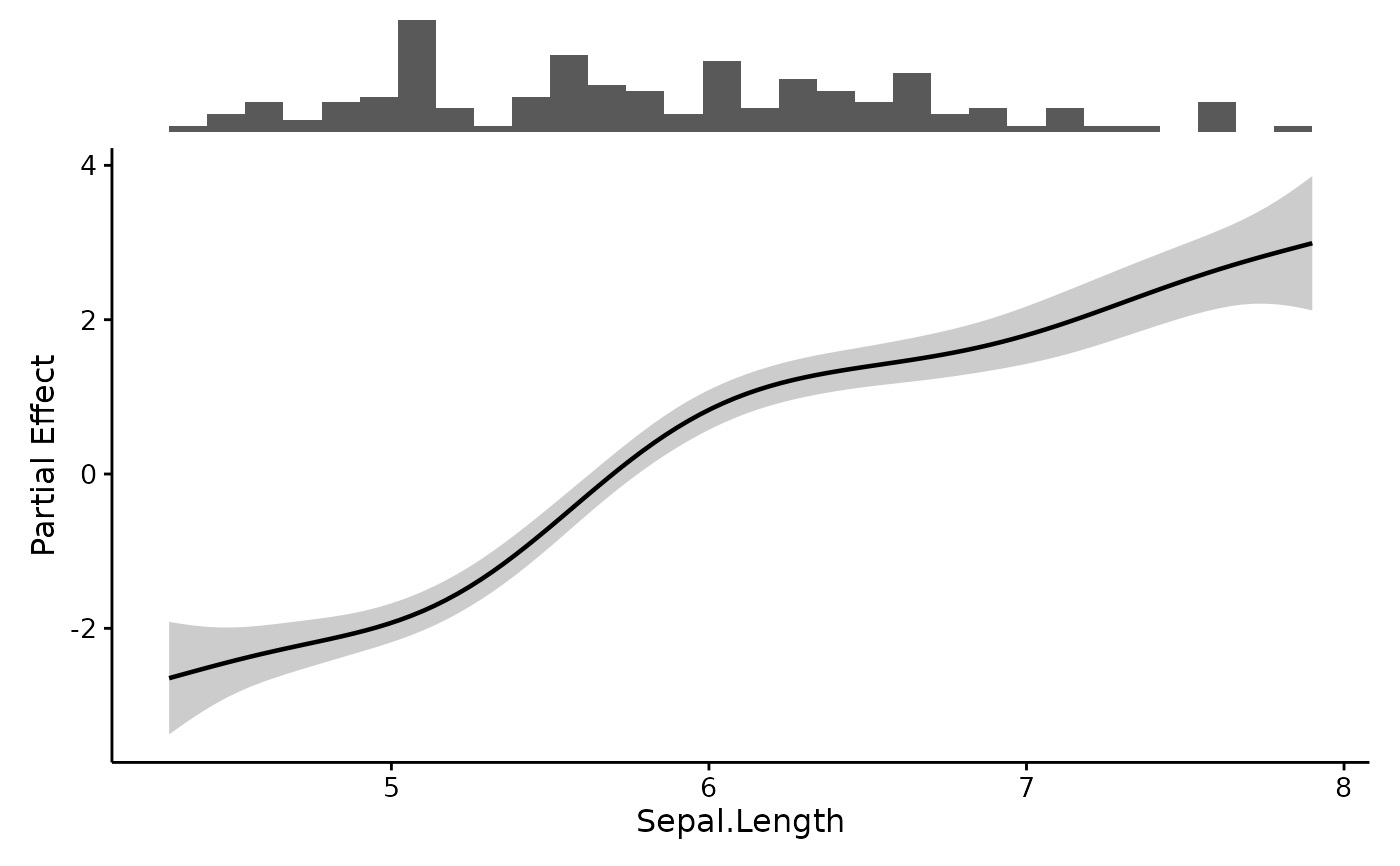
[Deprecated]
plotSmooths() was the GAM-only ancestor of plotEffects(). It still works
and still returns the same plot, but it warns once per session and will be
removed in a future release. Rename the call: every argument is unchanged,
and the defaults (scale = "link", interval = "se") reproduce exactly what
plotSmooths() drew.
Arguments
- model
GAM produced using mgcv.
- dat
Raw data used to fit the model, for the accompanying rug plot.
- var
Variable smooths to extract.
- xlab
Label for the x-axis. Defaults to the variable's own name.
- ylab
Label for y-axis of smooth plot; default is
"Partial Effect".- transform
Optional parameter indicating how to transform the variable, if applicable.
- rug.type
Type of rug plot to draw beneath the smooth.
- bins
Number of bins for a histogram rug.
See also
plotEffects(), which replaces this function.
Other effect plots:
combinePlots(),
comparePlots(),
plotEffects(),
plotRugs()
Examples
gam.fit <- mgcv::gam(Petal.Length ~ s(Sepal.Length), data = iris)

# Deprecated:
# plotSmooths(gam.fit, iris, "Sepal.Length")

# Use instead:
plotEffects(gam.fit, iris, "Sepal.Length")