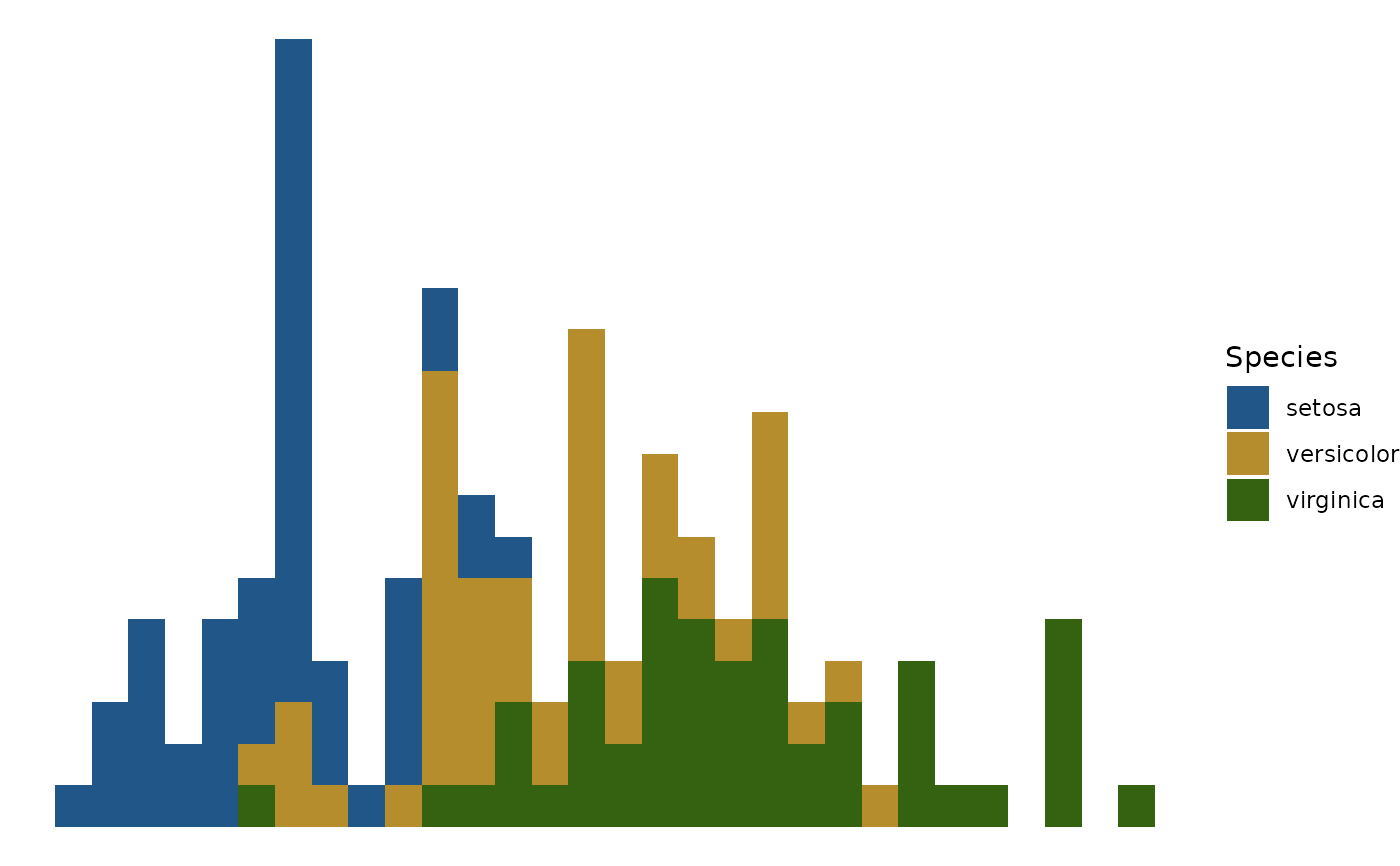
The companion to a smooth plot: it shows where the data actually is, so a bend in a smooth can be read against how much evidence sits under it.
Arguments
- dat
Raw data
- var
Variable to plot
- type
Optional parameter indicating type of plot; default is histogram
- transform
Optional parameter indicating how to transform the variable, if applicable
- bins
Number of histogram bins. Set explicitly rather than left to
geom_histogram()'s default, which is the same 30 but emits a message about it on every plot. Ignored whentypeis"density".- fill
Fill colour for the rug. Deliberately a neutral grey: the rug reports where the data is, and should not compete with the effect curve below it for attention. Ignored when
groupsplits the rug, which colours it by level instead.- group
Optional name of a factor column in
datto split the rug by, as a string. Under a factor-smooth interaction each curve is fitted to one level's data only, so an undivided rug reports evidence that does not belong to the curve the reader is looking at. Split, each level's share of the data is drawn in that level's own colour.- palette
Colours for the split, as a vector named by level – the names are what tie a band of rug to its curve, so an unnamed vector is assigned in level order and a
NULLleaves the scale to ggplot2. Levels the palette does not name are dropped from the rug rather than drawn in a colour that belongs to another curve.
See also
plotEffects(), which stacks this above an effect curve for you.
Other effect plots:
combinePlots(),
comparePlots(),
plotEffects(),
plotSmooths()
Examples
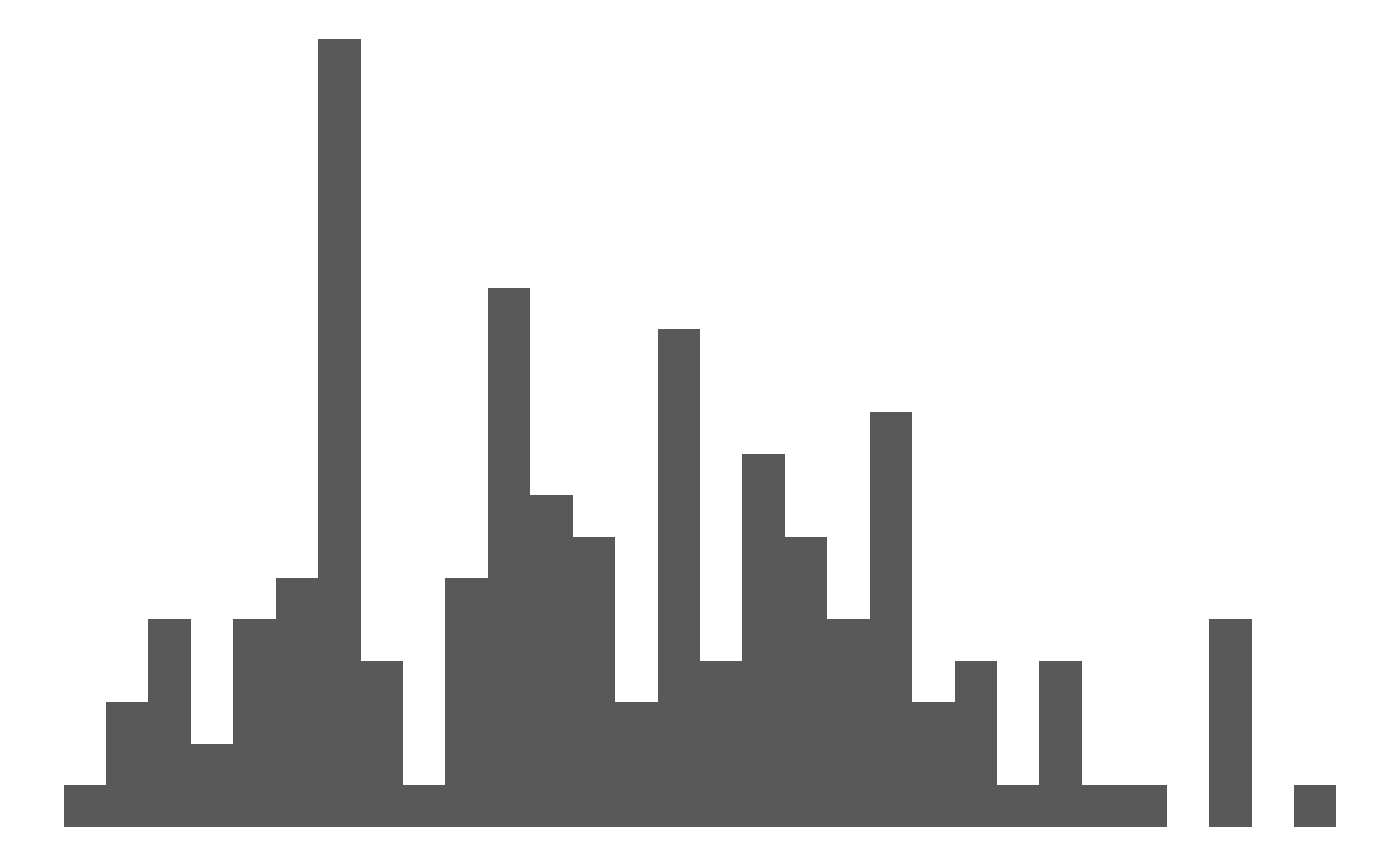
plotRugs(iris, "Sepal.Length")
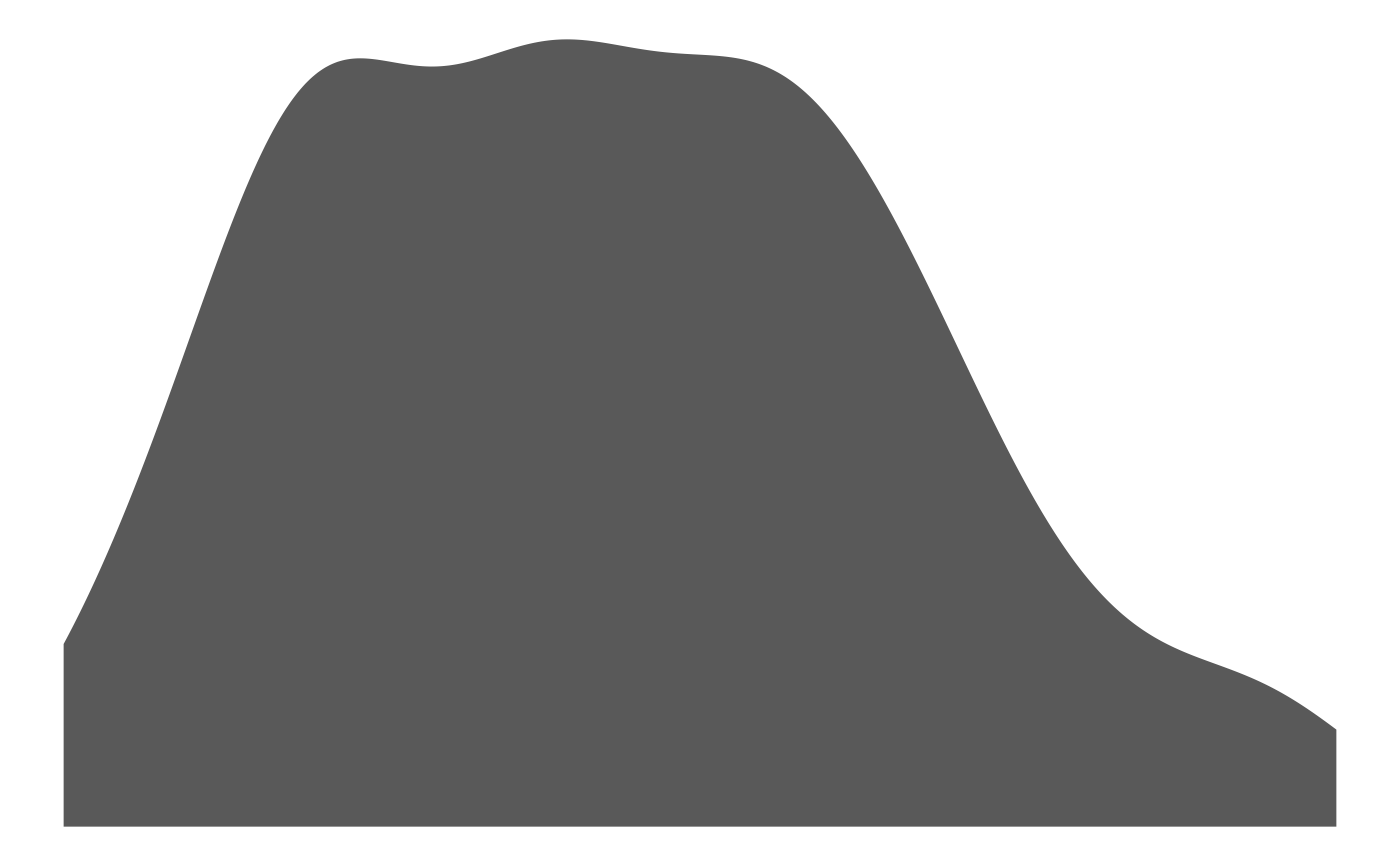
 plotRugs(iris, "Sepal.Length", type = "density")
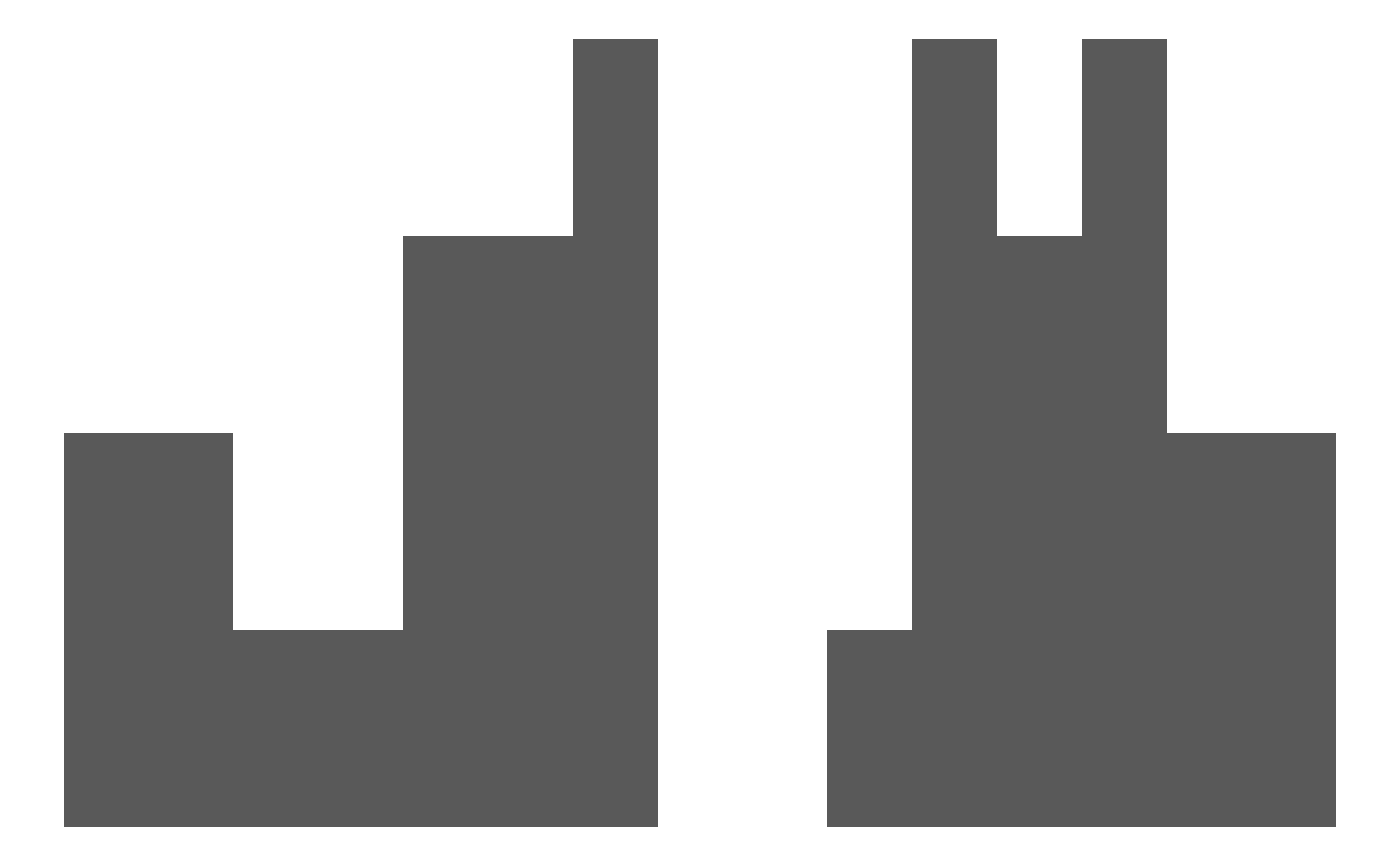
 plotRugs(mtcars, "disp", transform = "log10", bins = 15)
 # Split by a factor, in the palette the effect curves use
plotRugs(iris, "Sepal.Length", group = "Species",
palette = fancyfx_palette(3))
# Split by a factor, in the palette the effect curves use
plotRugs(iris, "Sepal.Length", group = "Species",
palette = fancyfx_palette(3))