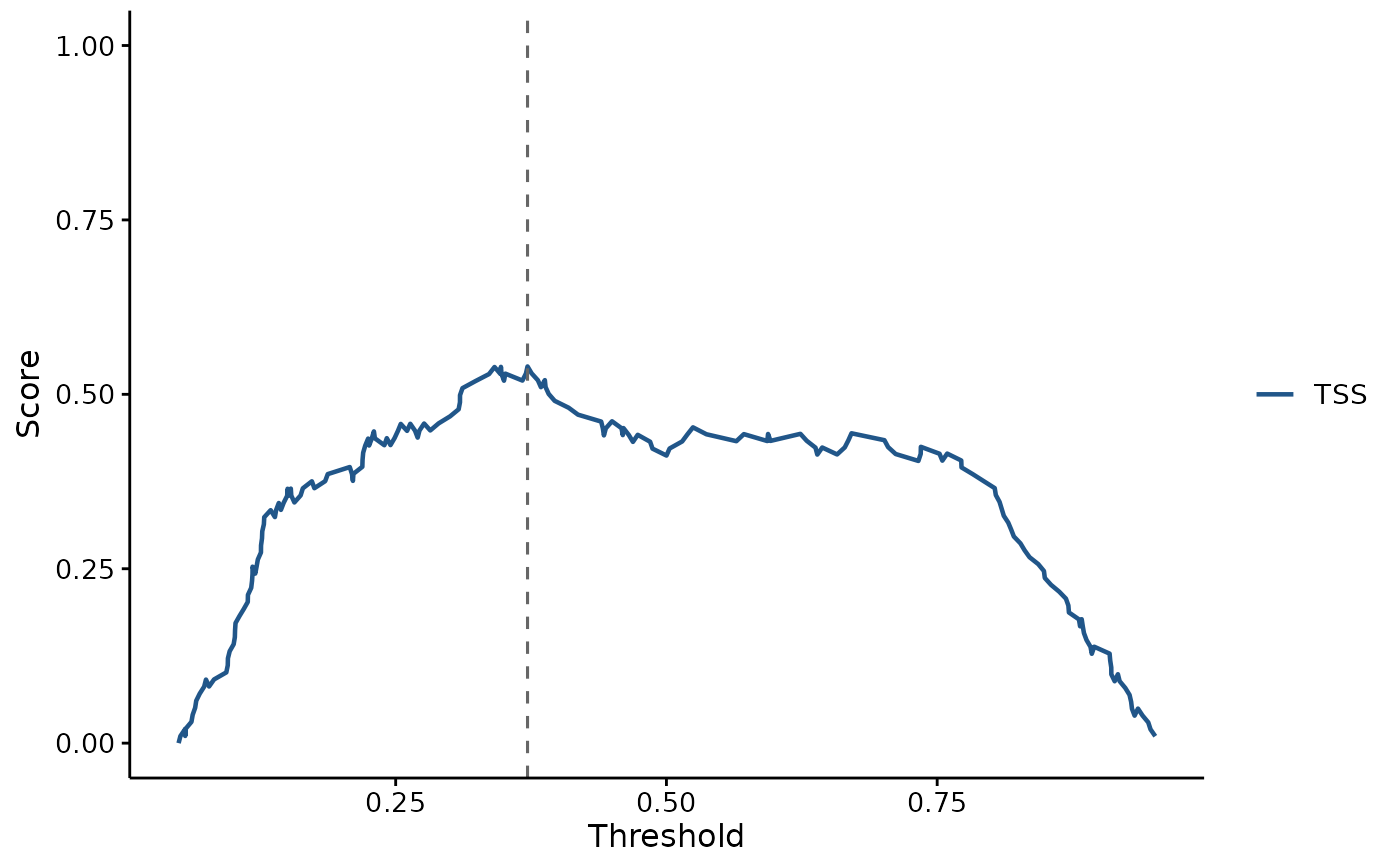
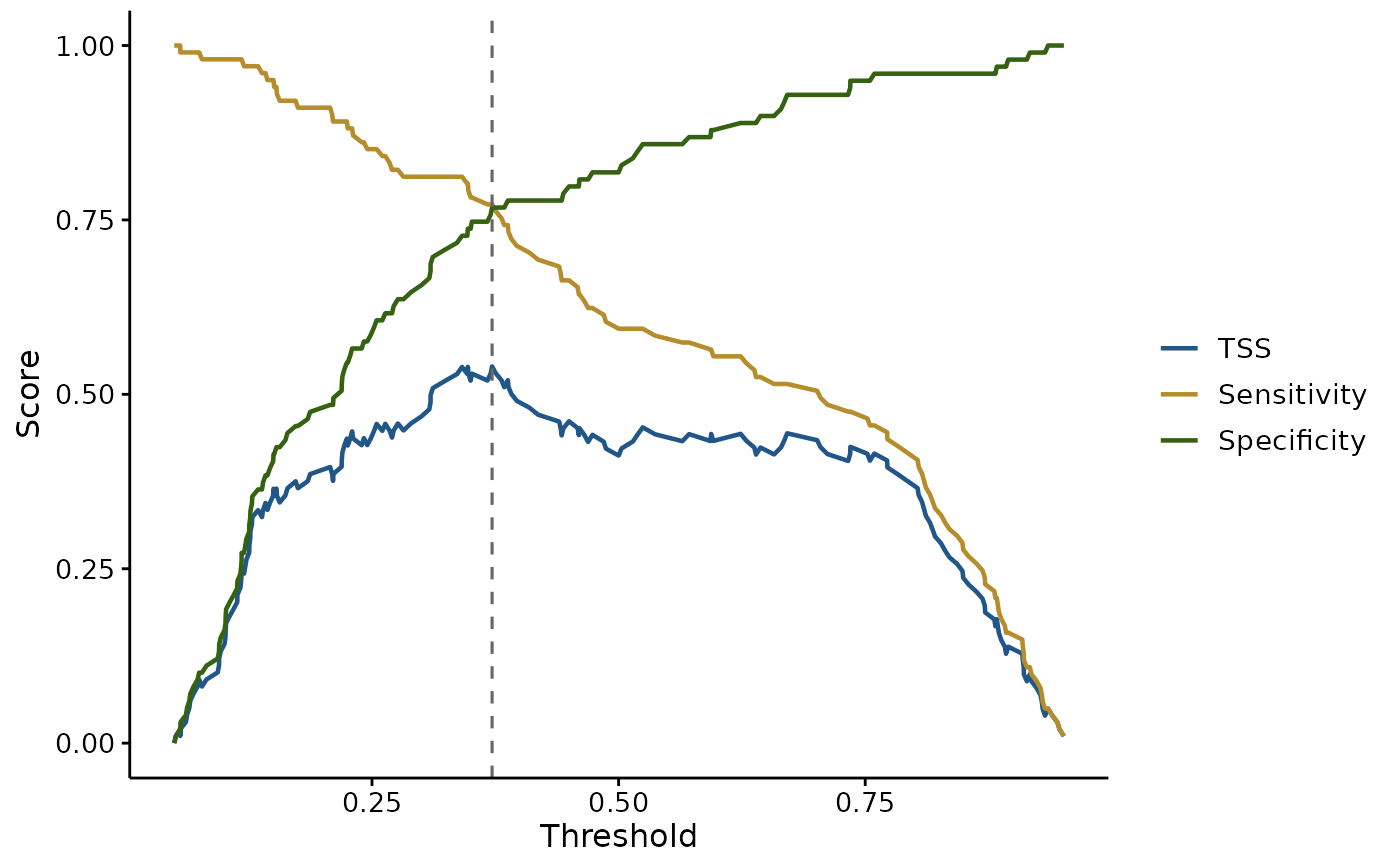
Sensitivity, specificity and the True Skill Statistic across every cutoff, with the TSS-maximising threshold marked. The plot a decision actually needs: a ROC curve says how well the model ranks, this says where to cut.
Usage
plotThreshold(
  model,
  newdata = NULL,
  folds = NULL,
  metrics = c("tss", "sensitivity", "specificity"),
  title = "",
  mark.best = TRUE,
  theme = theme_fancyfx(),
  palette = fancyfx_palette(),
  linewidth = 0.8,
  ...
)
Arguments
- model
A fitted presence/absence model.
- newdata
Data to evaluate on. Required, and it should not be the data the model was fitted to – see
threshold_metrics().- folds
Optional fold identifiers, one per row of
newdata. Metrics are drawn per fold, so the spread in the chosen cutoff is visible.- metrics
Which curves to draw. Any of
"tss","sensitivity","specificity".- title
Plot title, optional.
- mark.best
Whether to mark the threshold maximising TSS.
- theme
A ggplot2 theme. Defaults to
theme_fancyfx().- palette
Colours for the metric curves. Defaults to
fancyfx_palette().- linewidth
Width of the curves.
- ...
Passed to
threshold_metrics()and on tostats::predict().
Details
Sensitivity and specificity trade off against each other, and TSS is their sum less one – so its peak is the cutoff balancing them best. That is one defensible choice of threshold, not the only one: if a false absence costs more than a false presence, the right cutoff is not where TSS peaks, and the two curves are drawn so that judgement can be made rather than assumed.
With folds, the TSS-maximising cutoff is marked per fold. Those marks
scattering widely is worth more than any single number: it means the chosen
threshold is unstable, and reporting one to three decimal places would be
false precision.
Examples
set.seed(1)
dat <- data.frame(x1 = runif(400, 1, 10), x2 = runif(400, 1, 10))
dat$y <- rbinom(400, 1, plogis(-3 + 0.6 * dat$x1))
fit <- glm(y ~ x1 + x2, data = dat[1:200, ], family = binomial)
plotThreshold(fit, dat[201:400, ])
 # TSS alone, without the two curves it is built from
plotThreshold(fit, dat[201:400, ], metrics = "tss")
# TSS alone, without the two curves it is built from
plotThreshold(fit, dat[201:400, ], metrics = "tss")